Browsing,
Graphing, and Reporting

iList
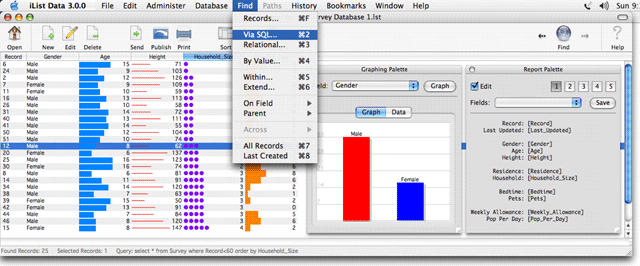
Data supports ten find modes plus inline and summary graphs for browsing data
graphically. Create bar, line, and pie graphs. View bar, line, and dot graphs
inline with your data.
Create
up to five reports per table. Create unlimited dynamic reports that change depending
on what record is selected. Send reports to iList Data's Report palette or to
your web browser. Add headers and footers and use HTML to format and layout
your reports.
Click
on the screenshot above to view iList Data's inline and summary graphing features
close up. Access to iList Data's ten search modes is via the Find menu. Reports
can also be easily created as shown on the right. With its integrated support
for graphing and the simple editing of reports, iList Data is an ideal educational
tool for teaching data management skills to students of all ages.
iList
Data's ten find modes include:
- Find
Records: Search for records using a user designed find
window.
- Find
Via SQL: Build a custom SQL query. Features support
for relational queries.
- Find
By Value: Search for unique field values.
- Find
Within: Constrain the current search to include less
records.
- Find
Extend: Broaden the current search to include more
records.
- Find
on Field: Display all records that match a selected
field value.
- Find
Parent: Display all records that match the subset of
a selected field value.
- Find
Across: Navigate from the current table to a related
table via a common field value.
- Find
All Records: Display all of the records in the current
table.
- Find
Last Created: Display the last created record in the
current table.
|